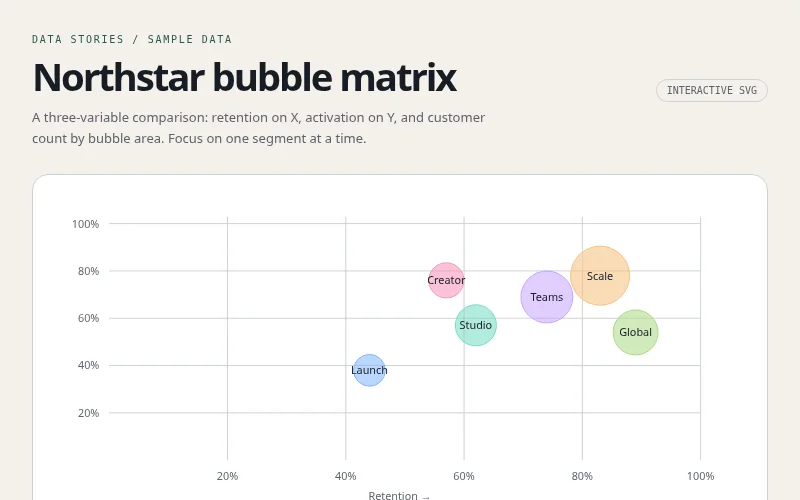
component
Explore creation
A three-variable comparison: retention on X, activation on Y, and customer count by bubble area. Focus o…
Explore the details. Inspect the code. Take it somewhere new.
A three-variable comparison: retention on X, activation on Y, and customer count by bubble area. Focus o…
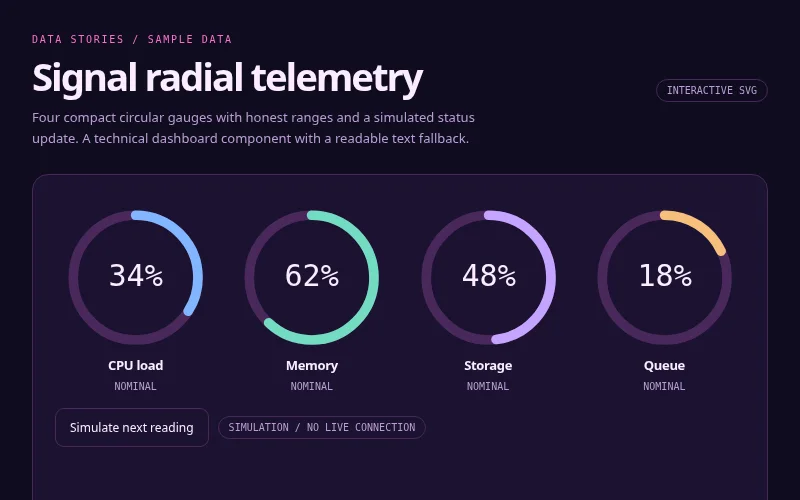
Four compact circular gauges with honest ranges and a simulated status update. A technical dashboard com…
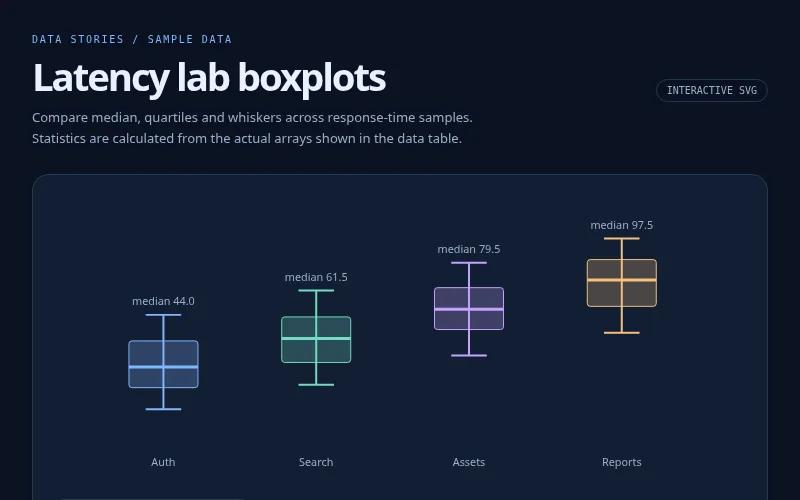
Compare median, quartiles and whiskers across response-time samples. Statistics are calculated from the …
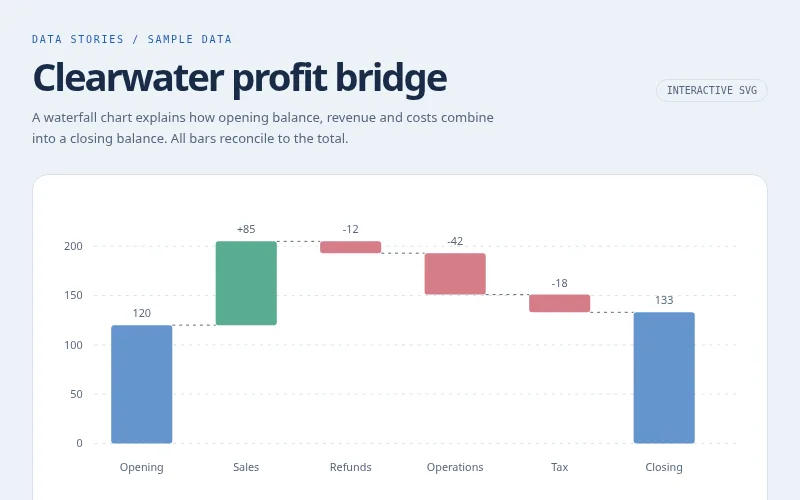
A waterfall chart explains how opening balance, revenue and costs combine into a closing balance. All ba…
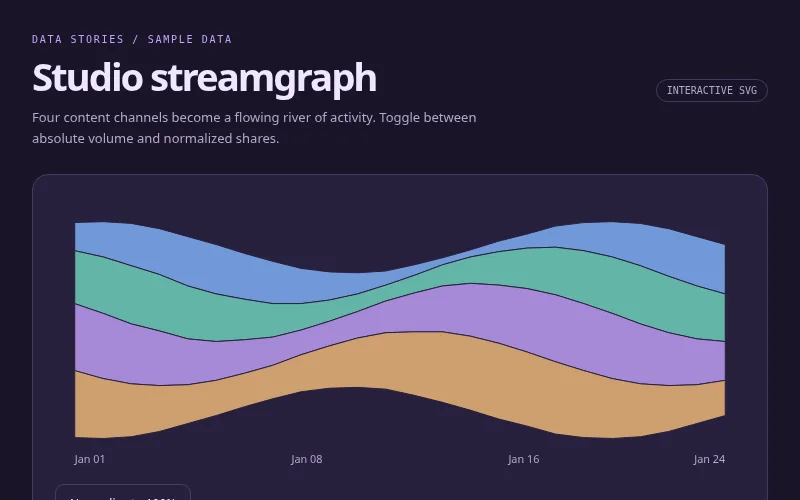
Four content channels become a flowing river of activity. Toggle between absolute volume and normalized …
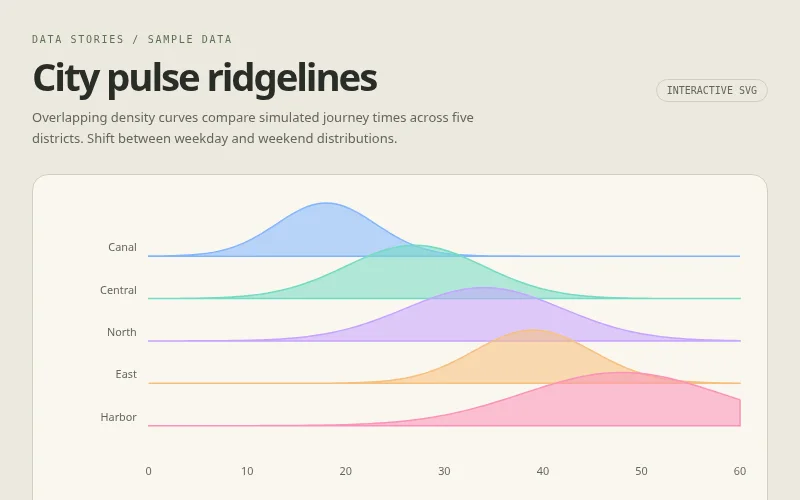
Overlapping density curves compare simulated journey times across five districts. Shift between weekday …
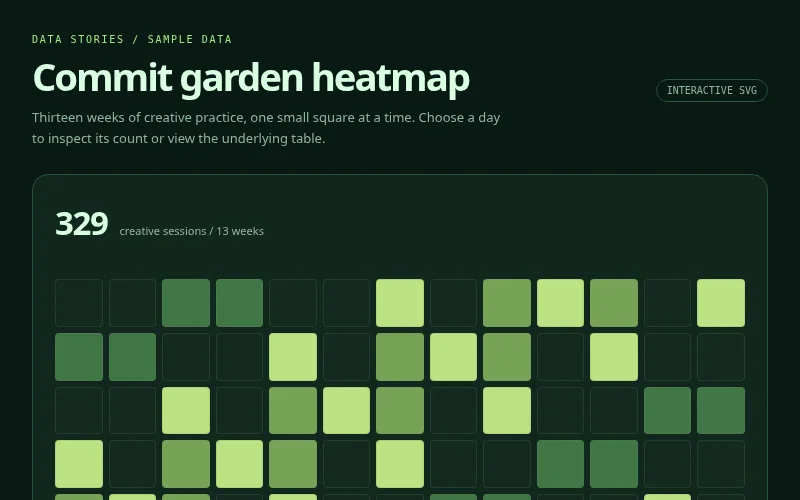
Thirteen weeks of creative practice, one small square at a time. Choose a day to inspect its count or vi…
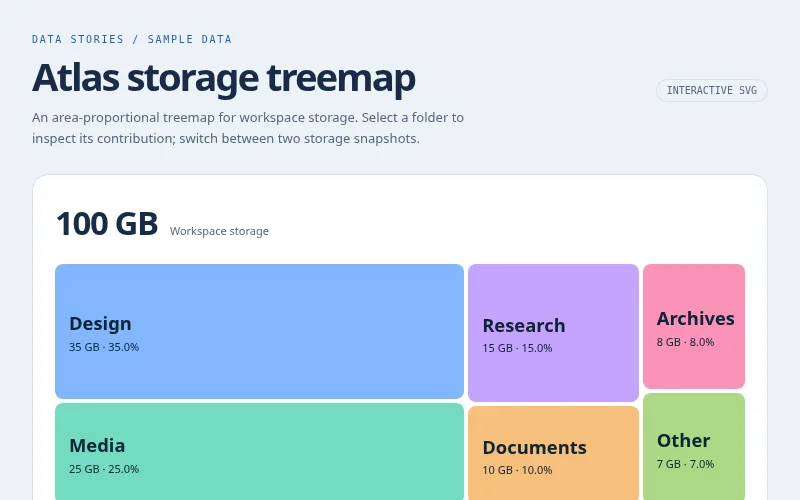
An area-proportional treemap for workspace storage. Select a folder to inspect its contribution; switch …
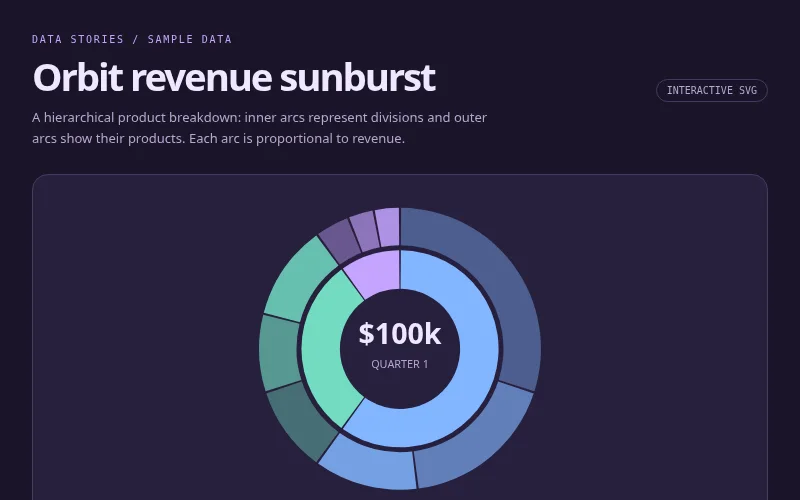
A hierarchical product breakdown: inner arcs represent divisions and outer arcs show their products. Eac…
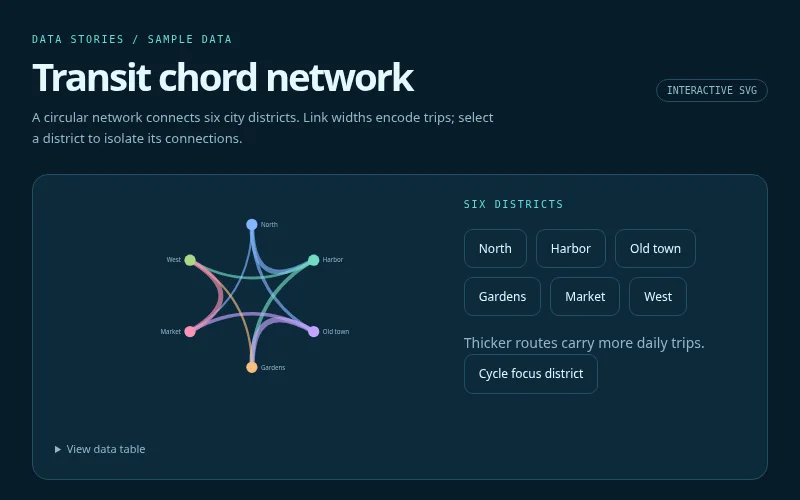
A circular network connects six city districts. Link widths encode trips; select a district to isolate i…
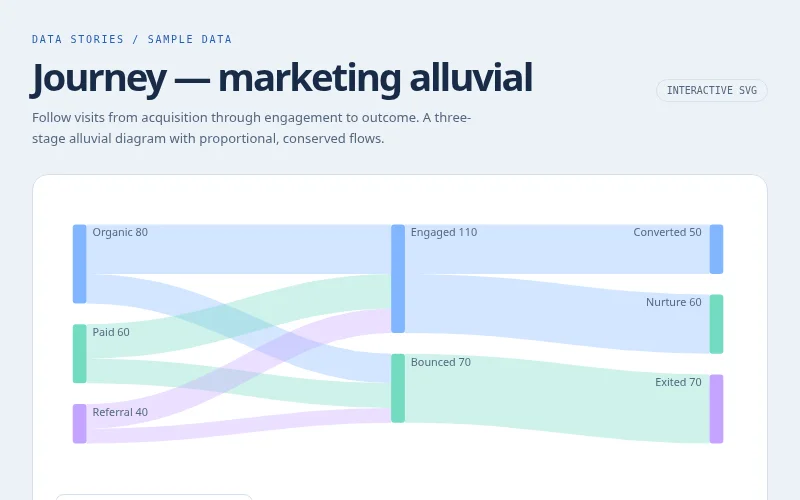
Follow visits from acquisition through engagement to outcome. A three-stage alluvial diagram with propor…
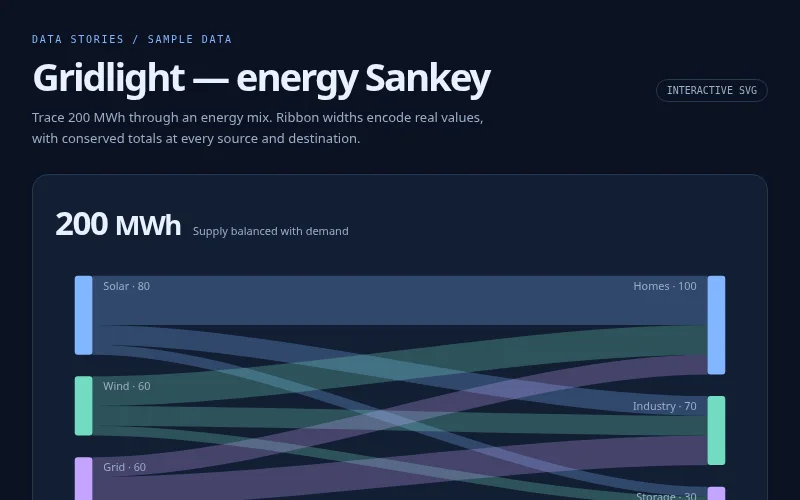
Trace 200 MWh through an energy mix. Ribbon widths encode real values, with conserved totals at every so…